The melting ice
The ice in the Arctic is never the same. It freezes and thaws all the time. It builds up during winter, and it melts again during summer. In September most Arctic ice has melted, and it starts to build up again; in March, there is the largest amount of ice, and then it starts melting again. This, of course, is absolutely normal, in the same way that some lakes freeze and thaw each year. Whenever you are shown pictures of melting ice, you are probably not told that this is the routine melting of ice each summer, and not anything special.
Figure 1 shows what is the minimum ice extent each year; that is, what is the ice extent in September.
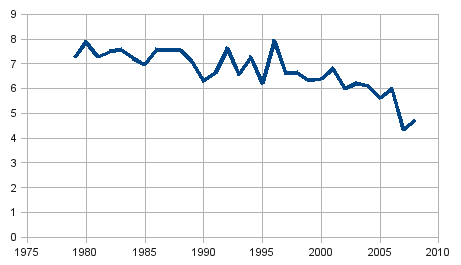
Figure 1: Arctic ice extent (millions of sq. km) in September
How do we know?
How do we know the ice extent in the sea? We know it because the sea at the poles is being photographed by satellites on a daily basis, since 1979. Extracting the ice extent as a number of square kilometres from the photographs requires image processing, and different scientists arrive at different results. This is one reason why the chart above might not be exactly the same as those you've seen elsewhere. Another reason is that some people might include only the Arctic ocean in their calculations, whereas others include some bays around Greenland or so. The big picture, however, remains the same; the ice is being photographed, and there is little room for interpreting the photographs. This means that the chart above is close to being a fact.
Ice extent before 1979, however, is an estimation, because it mostly comes from historical records given by ships, and it requires lots of assumptions to arrive at generalized results from records that are sparse in both time and location. Although this point does not affect our discussion about the melting ice, we make it because, later on, the distinction between fact and estimation will be of tremendous importance.
Whenever you see publications showing a worrying decreasing trend in the Arctic ice, it is always the September ice. Many publications do mention that it is the "minimum annual ice extent" they are talking about. Some do not, but you can check that it is the same thing by comparing with other publications. In any case, you can check the data for yourself [1].
Although the September ice extent does show an interesting falling trend, there is nothing that makes it representative of the planet's temperature any more than the March ice extent; or the annual average extent. What's more, the Earth has two poles, and there is nothing in the North Pole that makes it more representative than the South Pole. Figure 2 shows six charts together; the top left we've already seen, and the other five are new. (We include data only up to 2007 in these charts, because 2008 has not been added to the data compilations that include the entire record from 1979; however, recent data are available elsewhere and are updated on a daily basis [2].)
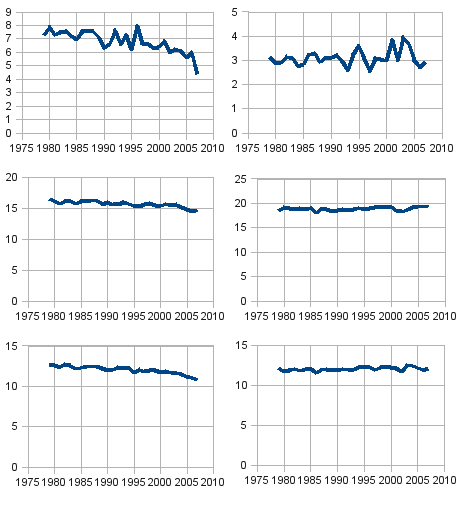
Figure 2: Ice extent (millions of sq. km): Arctic on the left, Antarctic on the right; minimum extent at the top (September for the Arctic, March for the Antarctic), maximum extent in the middle (March for the Arctic, September for the Antarctic), annual average at the bottom.
If we assume that there is something in ice extent that is representative of the planet's temperature, wouldn't that be the total ice extent, north and south added? Figure 3 shows that.
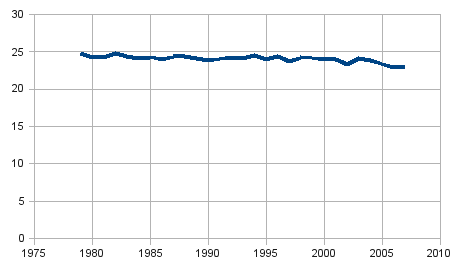
Figure 3: Total ice extent (millions of sq. km), annual average, for both Arctic and Antarctic
As we can see in these charts, the total ice has, indeed, been constantly shrinking during the last 30 years, by 10%. What we want to point out right now is that this shrinking of total ice is in no way so marked as is the September Arctic ice, which is what is being featured in publications as the alleged evidence of how devastatingly fast man-made global warming progresses. But if this reasoning were correct, then we could equally say that the planet is cooling, since the Antarctic ice extent has been slightly increasing.
Another argument goes that the Arctic ice has not only shrunk in extent, but it has thinned, from an average of 3 metres to an average of 2 metres during the last 50 years. But whereas the ice extent is fact, because it is directly derived from satellite images, the so-called "average" ice thickness is an estimation, and a rough one. We have some measurements of ice thickness because occasionally submarines break the ice and emerge to the surface of the broken ice, and the captain records the thickness of the ice in the log; but if you have one measurement by a submarine in November 1960, and you have another measurement by another submarine, at a point 1000 km away, in September 1961, and so on, it takes a large number of questionable assumptions to correlate these sparse measurements. Attempts are also being made to derive the ice thickness from satellite images, but this is also questionable. When processing images in order to determine the ice extent, you know that something close to white is ice, and something close to blue is water; but it's not that simple to determine ice thickness, and it is debatable whether this is at all possible by processing a satellite image [3].
Another important point about the Arctic ice is that the last 30 years for which we have measurements is only a short period of time. In the summer of 2007 there was indeed the lowest ice extent during those 30 years, and the only year in which the Northwest Passage was clear of ice. The only year in those 30 years; not the only year in shipping history, as some media publications suggest. The passage is also known to have been clear at least in 1905, 1942, and 1944 [4]. In other words, when the media discusses the "all time" historical low of 2007, they demonstrate a very narrow understanding of "all time".
What we wanted to show in this chapter is that there is nothing nearly as alarming as advertised about the melting sea ice. But we admit that the total earth ice has, indeed, been shrinking very slowly during the last 30 years. Does this constitute evidence of man-made global warming? We will deal with this question, and with the interesting (but not unprecedented) changes in the Arctic, in a later chapter.
Next: The extreme weather
References
| [1] | Daily ice extent at the Arctic and Antarctic; http://sidads.colorado.edu/DATASETS/seaice/polar-stereo/trends-climatologies/ice-extent/nasateam/gsfc.nasateam.daily.extent.1978-2007.s, accessed on 2009-03-15. |
| [2] | Ice extent data for the Arctic Ocean are published by the Japan Aerospace Exploration Agency, Earth Observation Research Center (JAXA/EORC); http://www.ijis.iarc.uaf.edu/en/home/seaice_extent.htm, accessed on 2009-04-02. |
| [3] | John L. Daly, "The top of the world: is the North Pole turning to water?"; http://www.john-daly.com/polar/arctic.htm, accessed on 2009-04-06. |
| [4] | Noel Sheppard, "Reports of Record Arctic Ice Melt Disgracefully Ignore History", 9 September 2007; http://newsbusters.org/blogs/noel-sheppard/2007/09/09/reports-record-arctic-ice-melt-disgracefully-ignore-history, accessed on 2009-04-06. |