Epilogue: Chaos, Hurst-Kolmogorov behaviour, and uncertainty
Have you ever wondered how weather predictions are made? If you think that it's meteorologists looking at satellite pictures or weather maps and determining how current weather will move, you got it wrong. Weather predictions are made with weather models (these are similar to climate models, but they work at different scales and have some other differences). Let's see how it works.
Every 12 hours, meteorological centres around the world send meteorological balloons up. These are little balloons with several meteorological sensors attached, such as a thermometer and a pressure sensor, and a trasmitter that transmits the measurements to a ground station. As the balloon goes up in the atmosphere, the measurements are transmitted to the ground, and so the meteorological variables at many altitudes are recorded. These measurements from around the world are collected, together with measurements from ships and aeroplanes, and they tell us how the weather was at the time the measurements were made. In order to make the calculations needed for the prediction, the atmosphere is divided into little pieces in such a way that the temperature, pressure, etc., in each little piece is known by the measurements. Because we know the natural laws that describe how conditions in each piece are affected by its neighbouring pieces, we can calculate how each piece will evolve in time, and hence we have a prediction of the weather. The number of calculations required is huge and can only be performed by a computer. In other words, a computer simulates the atmosphere. The system of simulation is called a weather model. The input to the weather model (i.e. the measurements of the current weather) is called the initial conditions.
This way of weather forecasting was first used in the 1960s. Edward Lorenz, one of the first scientists to experiment with a weather model, tried to make a forecast for two months ahead, and for some reason he performed the calculation twice. Although in both calculations he used the same weather model and the same initial conditions, the results were completely different. At first he thought he had made an error, and after investigation he found that one of the times he had run the simulation he had rounded the initial conditions to the third decimal digit; the other time he had rounded to the sixth decimal digit [1]. This means that even if you could accurately determine the initial conditions in every place of the earth (and the atmosphere), you'd still be unable to predict the weather in two months: because an input temperature of 31.23856 and an input temperature of 31.23857 would give completely different results. The mathematical term for this is chaos; we say that a system is chaotic if infinitesimal differences in the initial conditions cause huge differences in the state of the system after some time. Weather models are chaotic, which means they become unstable when you try to forecast the weather two months ahead.
Another way to explain this is the well-known example with the hurricane and the butterfly. If you tried to forecast if a hurricane in America will form a month from now, and you knew exactly the laws of motion that describe the creation of the hurricane, and you knew the initial conditions (the present conditions) in every point of the atmosphere, you'd still be unable to forecast; because even a butterfly moving its wings in China would alter conditions enough in order to yield a different result. This does not mean that the butterfly is the cause of the hurricane; rather, it means that the creation of the hurricane is so sensitive to the infinitesimal difference that could be present in its "causes" that causality effectively disappears altogether and the hurricane is reduced to a random phenomenon.
It is easier to understand it if instead of trying to predict a hurricane we try to predict the outcome of a roulette. Suppose you know everything you need in order to calculate the outcome of the roulette: the initial velocity of the ball, the initial angle speed of the wheel, the weight, elasticity, and other properties of the ball, the properties of the roulette, the properties of the wheel, the temperature of the ball, roulette, and wheel, the air temperature and pressure, humidity, and so on. Would you be able to predict the outcome? The answer is no, because this, too, is chaotic, provided you spin the roulette reasonably fast and provided you give the ball a reasonable initial speed. A random collision of a molecule of air could make a difference large enough in order to change the outcome. This does not mean that the collision is the reason for the outcome; the outcome depends on everything and nothing at the same time, so that it is effectively random.
The roulette is an artificially created system with only 37 possible outcomes, each one with an equal probability. Natural systems are much more complicated than that. The atmosphere is incredibly more complicated, and while weather models can predict the weather for three, sometimes maybe four or five, days ahead, they can't do better, and no matter how much you improve the models or the knowledge of the initial conditions, you'll never be able to forecast more than two weeks ahead, simply because you don't know what all butterflies of the world are doing or will do, let alone all molecules of air in the atmosphere.
There are, however, important things that you know about the roulette. Although its results are random, you know that the average value is 18, and that the value ranges in a uniform manner from 0 to 36. You can think of roulette outcomes as random variations around a mean of 18, as Figure 1 shows. But the roulette is an extremely simple artificial system. Natural systems are much more complicated than that.
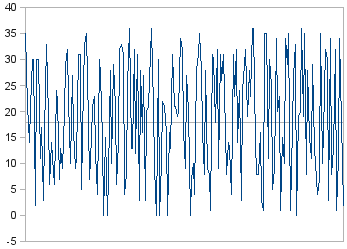
Figure 1: 200 random roulette outcomes
People have been tempted to think of climate in much the same way as a roulette, and that is the dominating view in climate science. It is alleged that the "climate", or "signal", is something like the average value of the roulette, with the "weather", or "noise", being something like the specific roulette outcome. It is alleged that the average temperature of the Earth is, say, 15°C, but the temperature in Athens in 13 April 2009 can be 22°C, in much the same way that the average roulette outcome is 18 but a specific roulette outcome can be 31. If you average many successive roulette outcomes, the result will be 18; and it is claimed that, similarly, if you average the temperature of all locations of the Earth for many successive years, the result will be, say, 15°C. The roulette outcome varies, but the underlying average remains the same. If the average of the roulette changes, this will be traced to a specific reason, such as a modification of the wheel; and it is assumed that a change in the "underlying climate" will always have a specific cause.
However, as you can see in Figure 2, which shows the temperature during the last 10 thousand years, the long-term behaviour of temperature is nothing like a roulette; and if you try to zoom out to 100 thousand years (Figure 3) or to 800 thousand years (Figure 4), you'll see that not only does it not get any better, but what you see after zooming out is nothing like what the previous chart suggested. It is likely that if we had data further into the past, and we could zoom out more, we would again see a picture very different from what we expect by looking at Figure 4. What looks like "signal" in Figure 2 is only "noise" in Figure 3, and what looks like "signal" in Figure 4 would again look like "noise" if we had enough data to further zoom out.
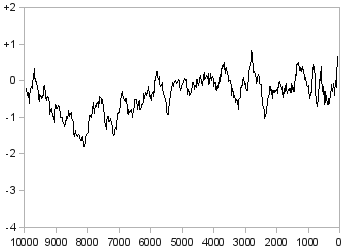
Figure 2: The temperature of the Earth during the last 10 thousand years (difference from today in °C)
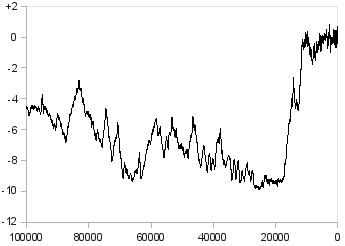
Figure 3: The temperature of the Earth during the last 100 thousand years (difference from today in °C)
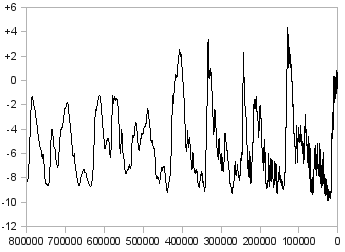
Figure 4: The temperature of the Earth during the last 800 thousand years (difference from today in °C) [2]
Roulette is unpredictable in the short term, but very predictable in the long term: you can look at its outcomes as random noise on a well-known signal. Roulette is very uncertain when you zoom in, but very certain when you zoom out. Climate is equally uncertain at all zoom levels. In fact, mathematical analysis of the climate indicates that its behaviour is such that the uncertainty is the maximum possible at all zoom levels. This maximisation of uncertainty at all scales is called the Hurst-Kolmogorov behaviour of climatic processes [3].
Nature loves uncertainty, and it fools us in two ways: on the one hand we wouldn't be able to predict the future of climate, even if we fully knew the natural laws that govern it, because of chaos; and on the other hand, we can't be very certain of the statistically expected behaviour of climate which is based on our observations of the past, because of the Hurst-Kolmogorov behaviour.
Changes in climate and the weather sometimes have a single dominant cause, and sometimes they are chaotic. The seasons, for example, are caused by the fact that the Sun's rays fall at a different angle in summer than in winter. A storm or a heat wave do not usually have a single dominant cause, but are created in a chaotic manner. Why does the climate change? Again, there can be identifiable dominant causes, or it can be a chaotic change. The man-made climate change hypothesis says that greenhouse gas emissions from human activities are the dominant cause; but we've shown that this hypothesis is unsupported. Whether there is any other dominant cause or whether these are routine chaotic changes is not resolved. We feel that it is the latter. We feel that our ignorance on what causes climate change is not because we haven't measured and studied enough, but because the uncertainty is structured in the climate, as it is structured in life itself. Humans do affect the climate, as they have always been doing, as butterflies also do, their actions contributing together with infinite other interacting actions to an infinitely complex and entirely unpredictable system, which depends on everything and yet on nothing, which is at the same time deterministic and random.
Harold Hurst
(1880–1978)
|
Andrey Kolmogorov
(1903–1987)
|

References
| [1] | N. G. Cooper, From Cardinals to Chaos: Reflections on the life and legacy of Stanislaw Ulam, Cambridge Univ. Press, 1989. |
| [2] | J. Jouzel et al., EPICA Dome C Ice Core 800KYr Deuterium Data and Temperature Estimates, IGBP PAGES/World Data Center for Paleoclimatology, Data Contribution Series #2007-091, NOAA/NCDC Paleoclimatology Program, Boulder CO, USA; ftp://ftp.ncdc.noaa.gov/pub/data/paleo/icecore/antarctica/epica_domec/edc3deuttemp2007.txt, accessed on 2009-08-06. |
| [3] | For more on the Hurst-Kolmogorov behaviour, see the relevant works by Koutsoyiannis, a list of which can be found at http://www.itia.ntua.gr/en/documents/?tags=Hurst (accessed on 2009-08-03) (Update: [4]). A relatively easy introduction is the following: D. Koutsoyiannis, Nonstationarity versus scaling in hydrology, Journal of Hydrology 324 (1-4), 239–254, doi: 10.1016/j.jhydrol.2005.09.022, 2006; available at http://www.itia.ntua.gr/en/docinfo/673/, accessed on 2009-08-03. The works by Kolmogorov and Hurst have historical significance: A. N. Kolmogorov, Wienersche Spiralen und einige andere interessante Kurven in Hilbertschen Raum, Doklady Akademii Nauk URSS 26, 115–118, 1940. H. E. Hurst, Long term storage capacities of reservoirs, Transactions of the American Society of Civil Engineers 116, 776–808, 1951. |
Updates
| [4] | For more information on all issues touched in this chapter, we now recommend Koutsoyiannis' outstanding and enlightening new paper: D. Koutsoyiannis, A random walk on water, Hydrology and Earth System Sciences 14, 585–601, 2010; available at http://itia.ntua.gr/el/docinfo/923/, accessed on 2010-04-16. 16 April 2010 |